AI-Enhanced Portfolio Dashboard: A Step-by-Step Guide
This article will guide you through navigating and utilizing your AI-enhanced portfolio dashboard. You'll learn how to access key features, interpret AI-driven insights, and leverage multi-agent analytics to make informed investment decisions. By the end of this guide, you'll be able to confidently use your dashboard to track performance, analyze risks, and optimize your investment strategy.
Accessing Your GenAI-Powered Dashboard:
To begin, log into your RAFA account using your credentials. Once logged in, you'll be greeted by the main dashboard. Look for the "Portfolio" tab in the bottom navigation menu and click it. This will take you to your AI-enhanced portfolio overview. For the best experience and most comprehensive analysis, we recommend linking your external investment accounts and crypto accounts, or creating your own custom portfolio within the app. This integration allows the AI to provide more accurate and personalized insights, enhancing your ability to make informed investment decisions.
Accessing Your GenAI-Powered Dashboard
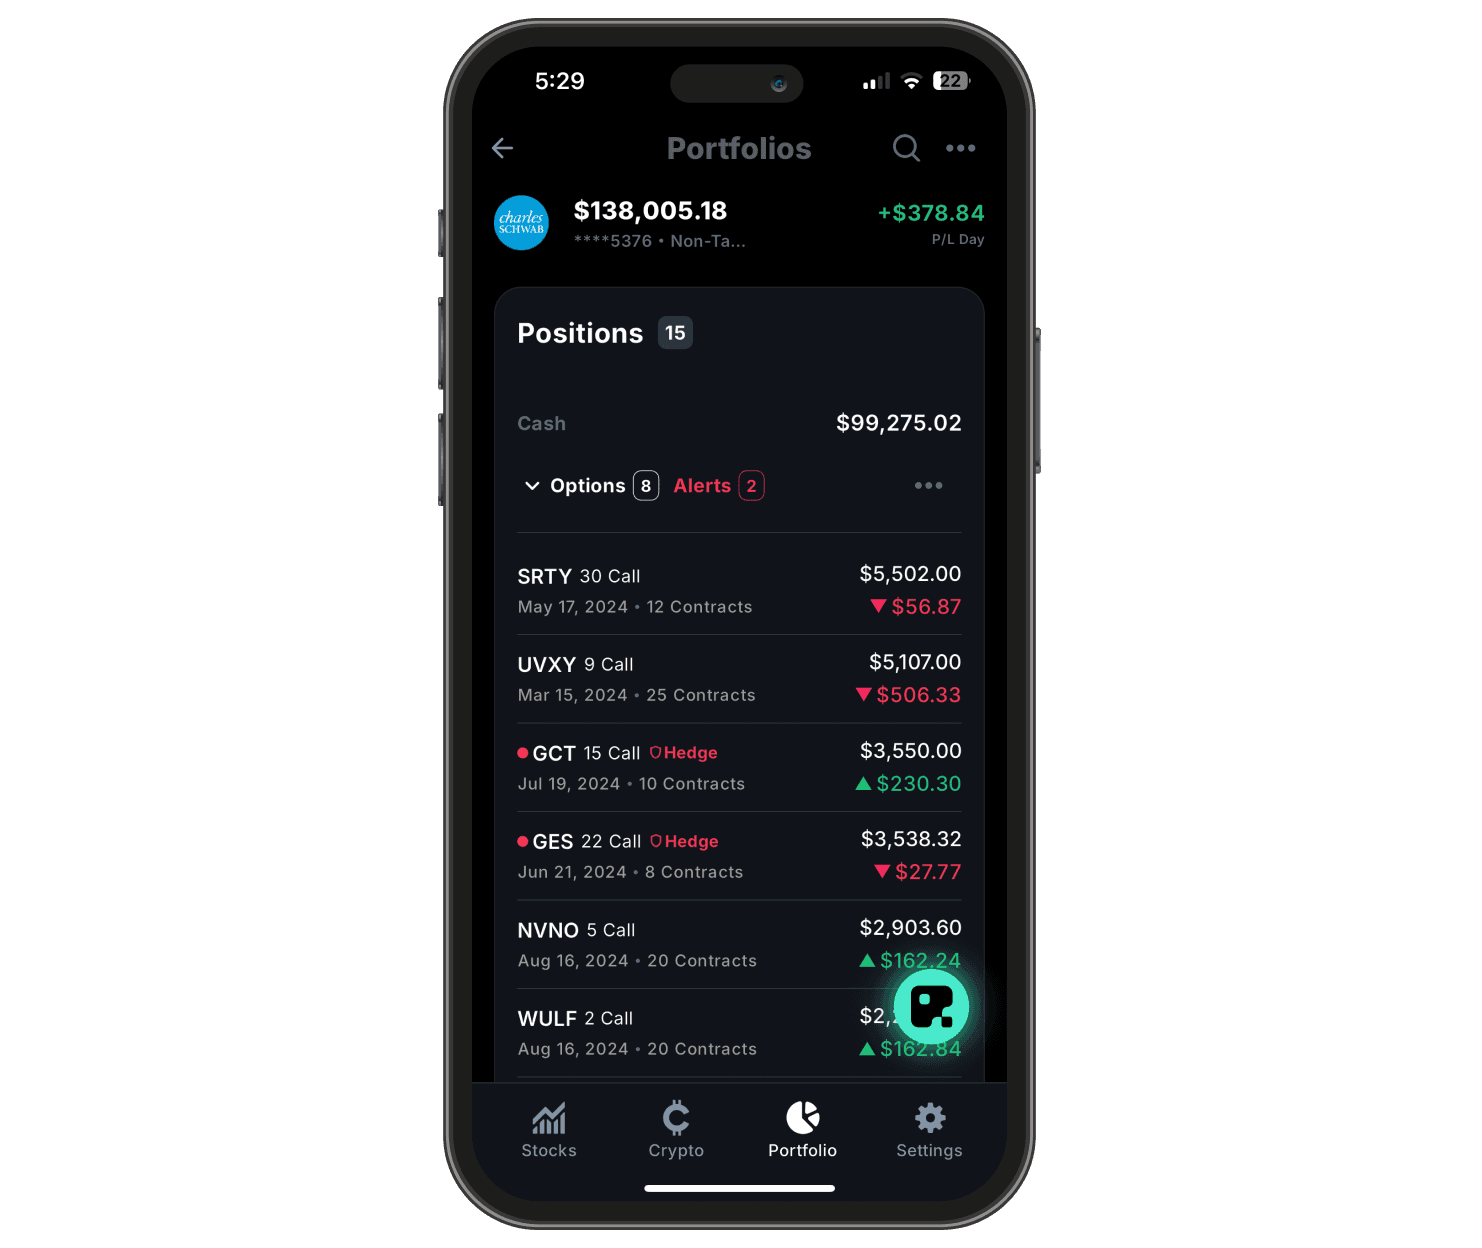
Upon accessing your dashboard, you'll see a comprehensive snapshot of your investment portfolio. At the top, you'll find your total portfolio value, along with the day's profit/loss, giving you an immediate sense of your portfolio's performance.
Below this, you'll see a breakdown of your positions, starting with your cash balance. The dashboard intelligently categorizes your investments, with a specific focus on different asset types, such as options in this view.
The AI-driven system provides a count of your total positions and highlights any alerts, indicating potential opportunities or risks that require your attention. This feature ensures you're always informed about critical aspects of your portfolio.
Each investment position is clearly displayed with key information:
The asset name and type
Relevant dates (such as expiration for options)
Quantity held
Current value
Profit/loss
A color-coding system provides an instant visual cue of each position's performance, making it easy to quickly assess which investments are gaining or losing value. Some positions may be marked with additional labels, such as "hedge," indicating their specific role in your overall investment strategy.
This AI-enhanced overview allows you to quickly assess your portfolio's composition, performance, and any positions that may need immediate attention, enabling more informed and timely investment decisions. The intuitive design ensures that even complex financial information is presented in an easily digestible format.
Portfolio Analysis Powered by AI
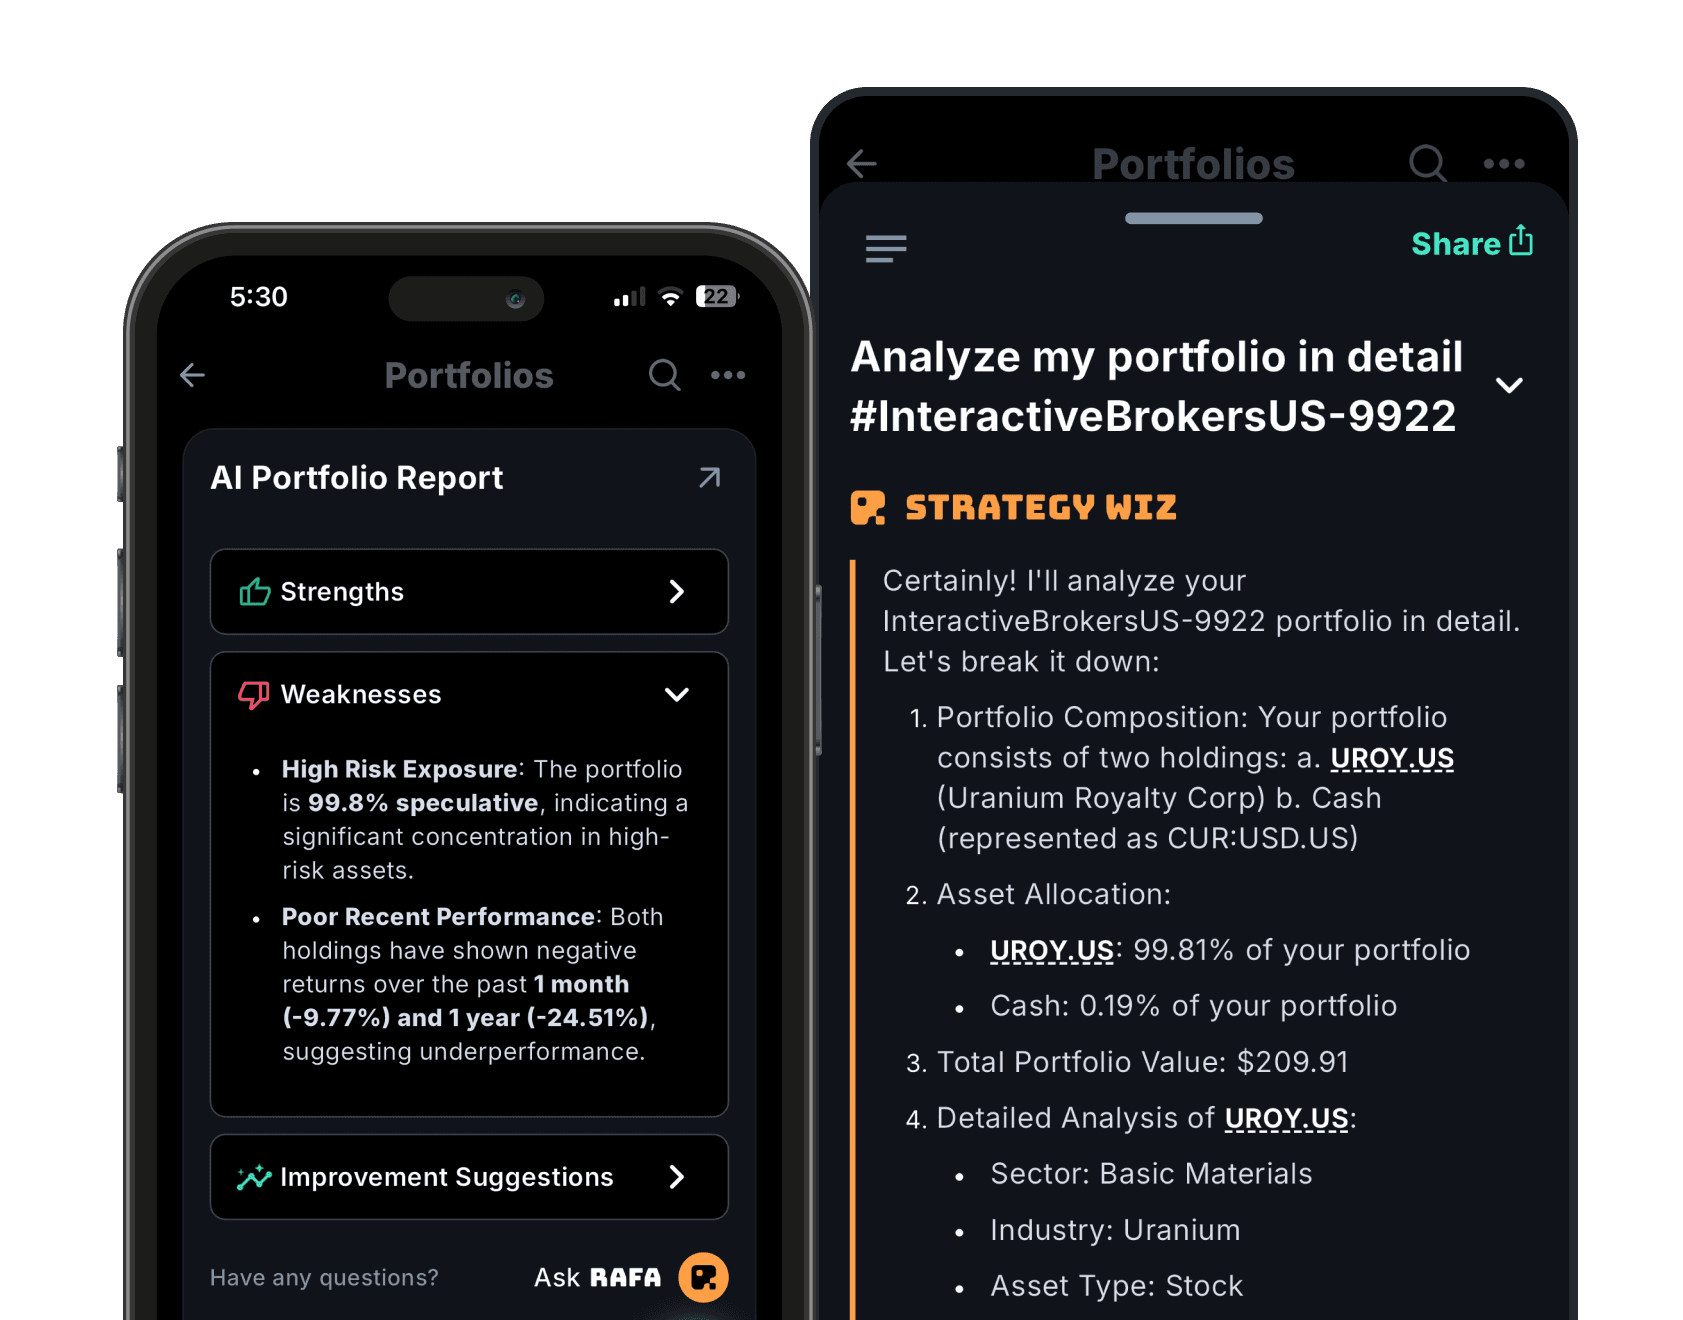
In this section of the app, users can access an AI-generated portfolio report that provides a comprehensive analysis of their investments:
AI Portfolio Report: Users can view an intelligent assessment of their portfolio, broken down into key categories:
Strengths: Highlights positive aspects of the portfolio
Weaknesses: Identifies areas of concern or potential improvement
Improvement Suggestions: Offers actionable recommendations for portfolio optimization
Detailed Analysis: Link an external account to get a portfolio-specific analysis.
This AI-driven analysis empowers users to gain a deeper understanding of their portfolio's composition and performance. By reviewing these insights regularly, investors can make more informed decisions about their investment strategy. The ability to ask questions directly to the AI Agents further enhances the user's capacity to explore and understand their financial position, enabling them to take proactive steps towards improving their investment outcomes.
AI Generated Portfolio Metrics
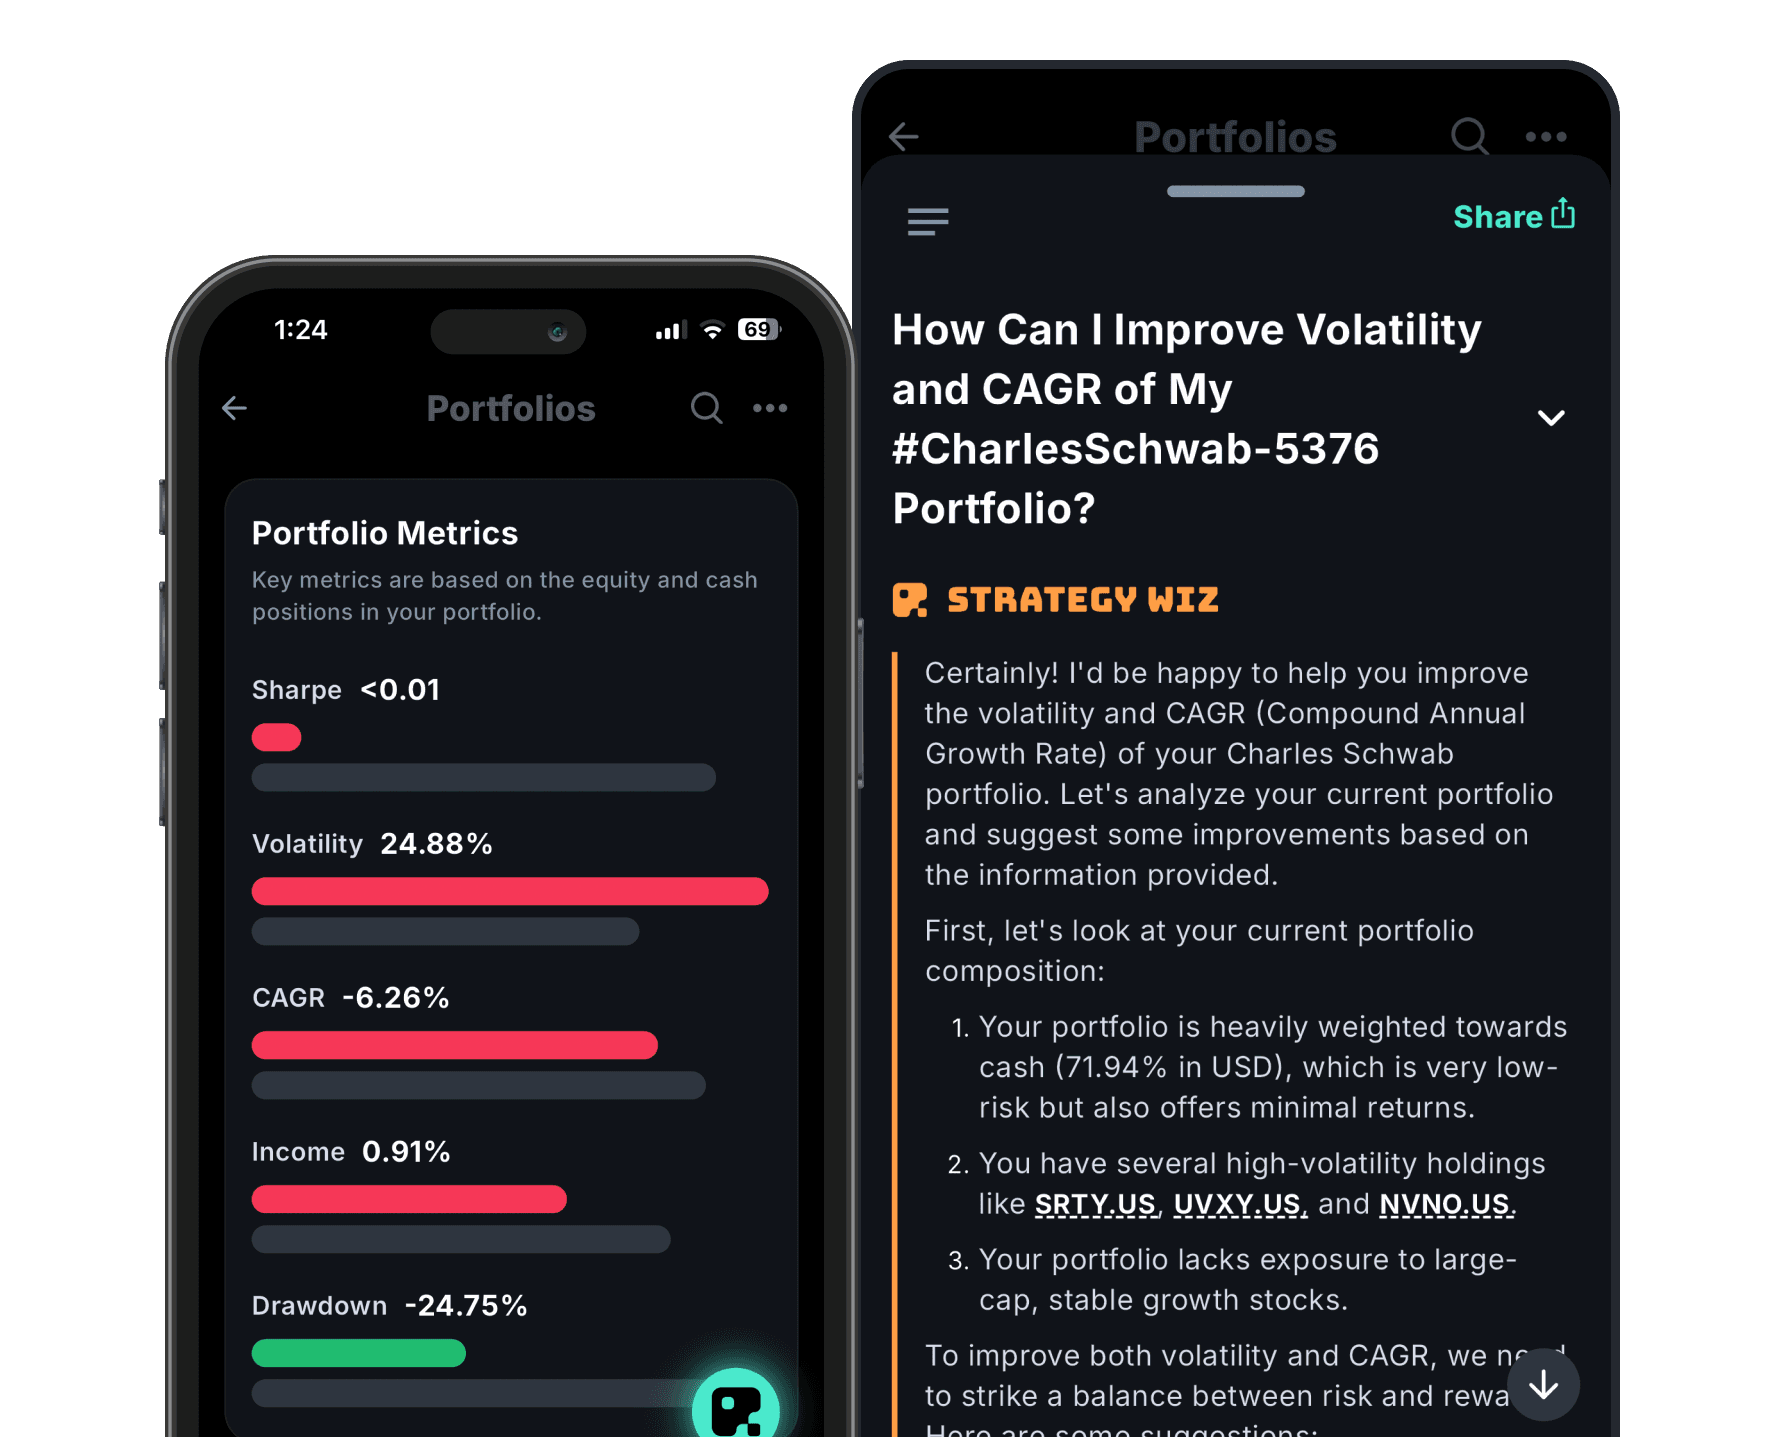
In this section of the app, users can gain valuable insights into their portfolio's Key Metrics:
Portfolio Metrics: Users can view key performance indicators that provide a comprehensive overview of their portfolio's health:
Sharpe Ratio: Measures risk-adjusted returns
Volatility: Shows portfolio price fluctuations
CAGR (Compound Annual Growth Rate): Indicates annualized return
Income: Displays yield from dividends or interest
Drawdown: Shows the largest peak-to-trough decline
This combination of quantitative metrics and AI-driven insights empowers users to make informed decisions about their investments. By regularly reviewing these metrics and engaging with the AI agents, users can gain a deeper understanding of their portfolio's strengths and weaknesses, and receive guidance on potential optimization strategies tailored to their specific financial situation and goals.
Utilizing Predictive Analytics for Strategy Optimization
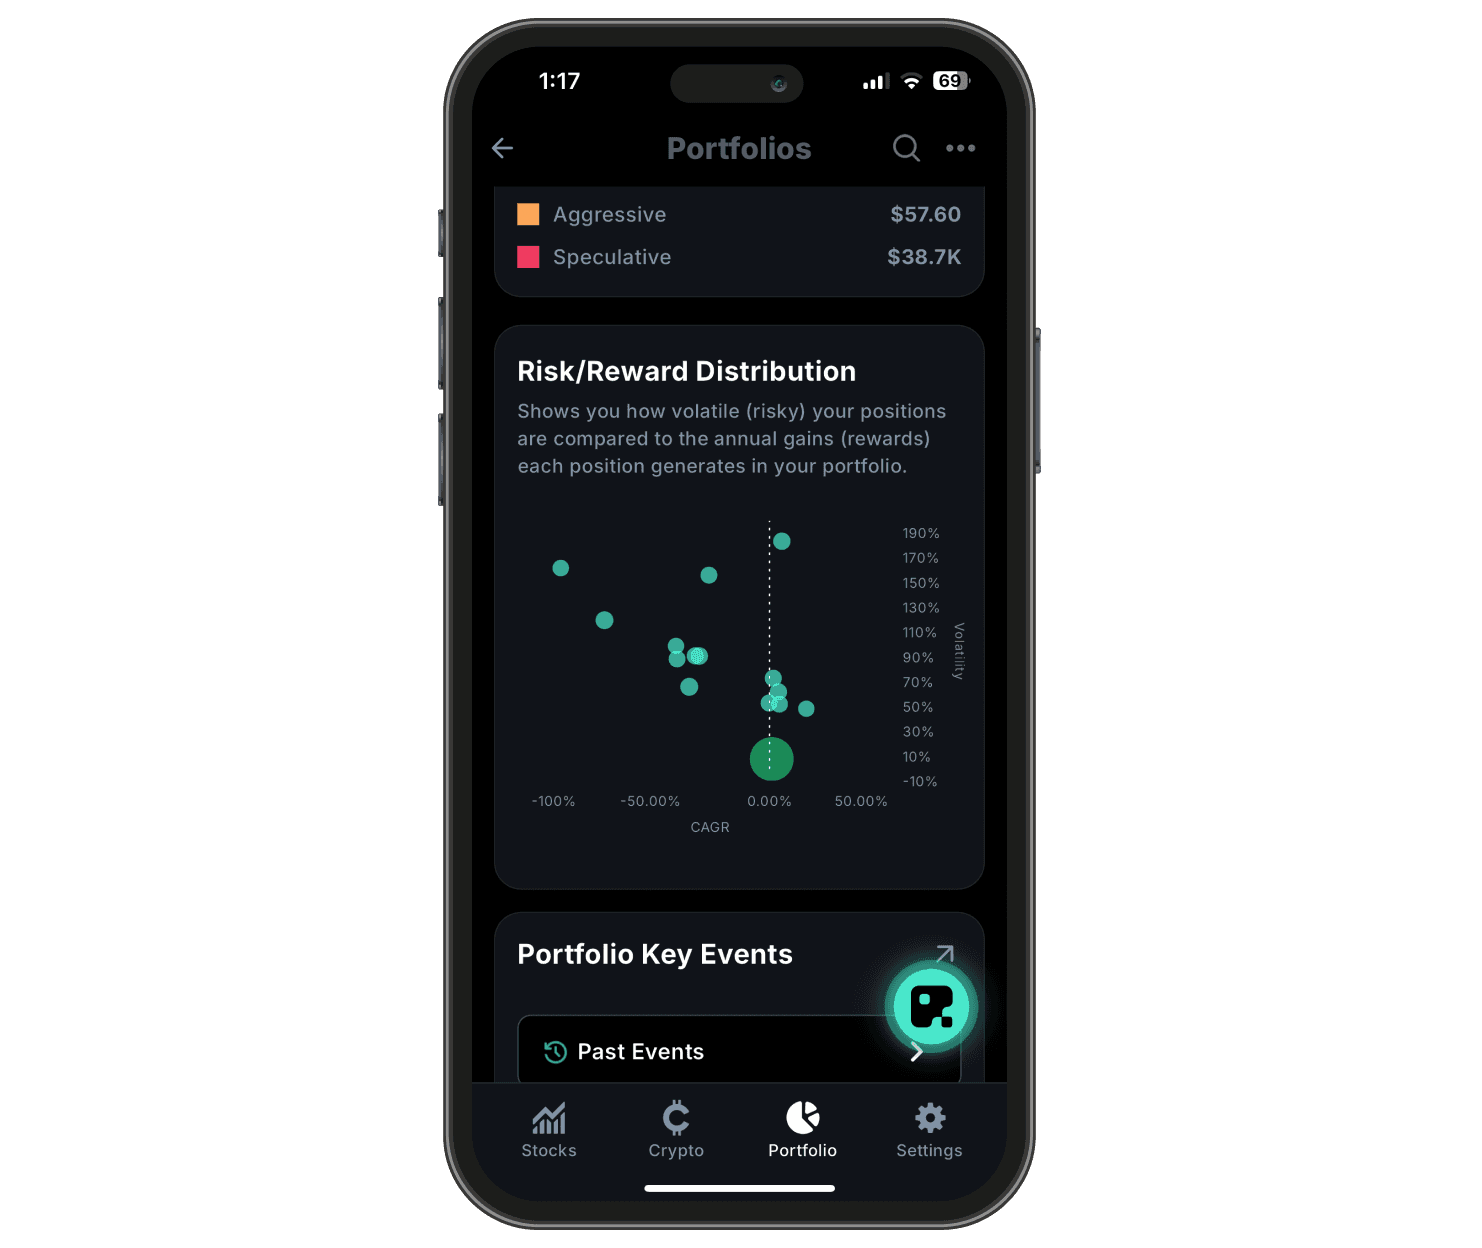
This section provides an overview of the Risk/Reward Distribution of your portfolio, showing how volatile your positions are compared to the Compound Annual Growth Rate for each position. Here’s how you can use this page:
Each dot represents a stock or asset, with CAGR (Compound Annual Growth Rate) on the horizontal axis and Volatility on the vertical axis. Higher positions on the chart indicate more volatile investments, while those further to the right show higher returns.
Analyze Risk vs. Reward: The farther a position is to the right of the vertical axis, the higher the potential return. Conversely, positions further up suggest greater risk due to volatility.
Identify Outliers: Note any extreme positions, especially those that are far left or high on the chart.
This section empowers you to make informed decisions about rebalancing or adjusting your positions based on the visualized trade-off between risk and reward.
AI-Driven Insights & Key Events: Stay Updated with Real-Time Multi-Agent News
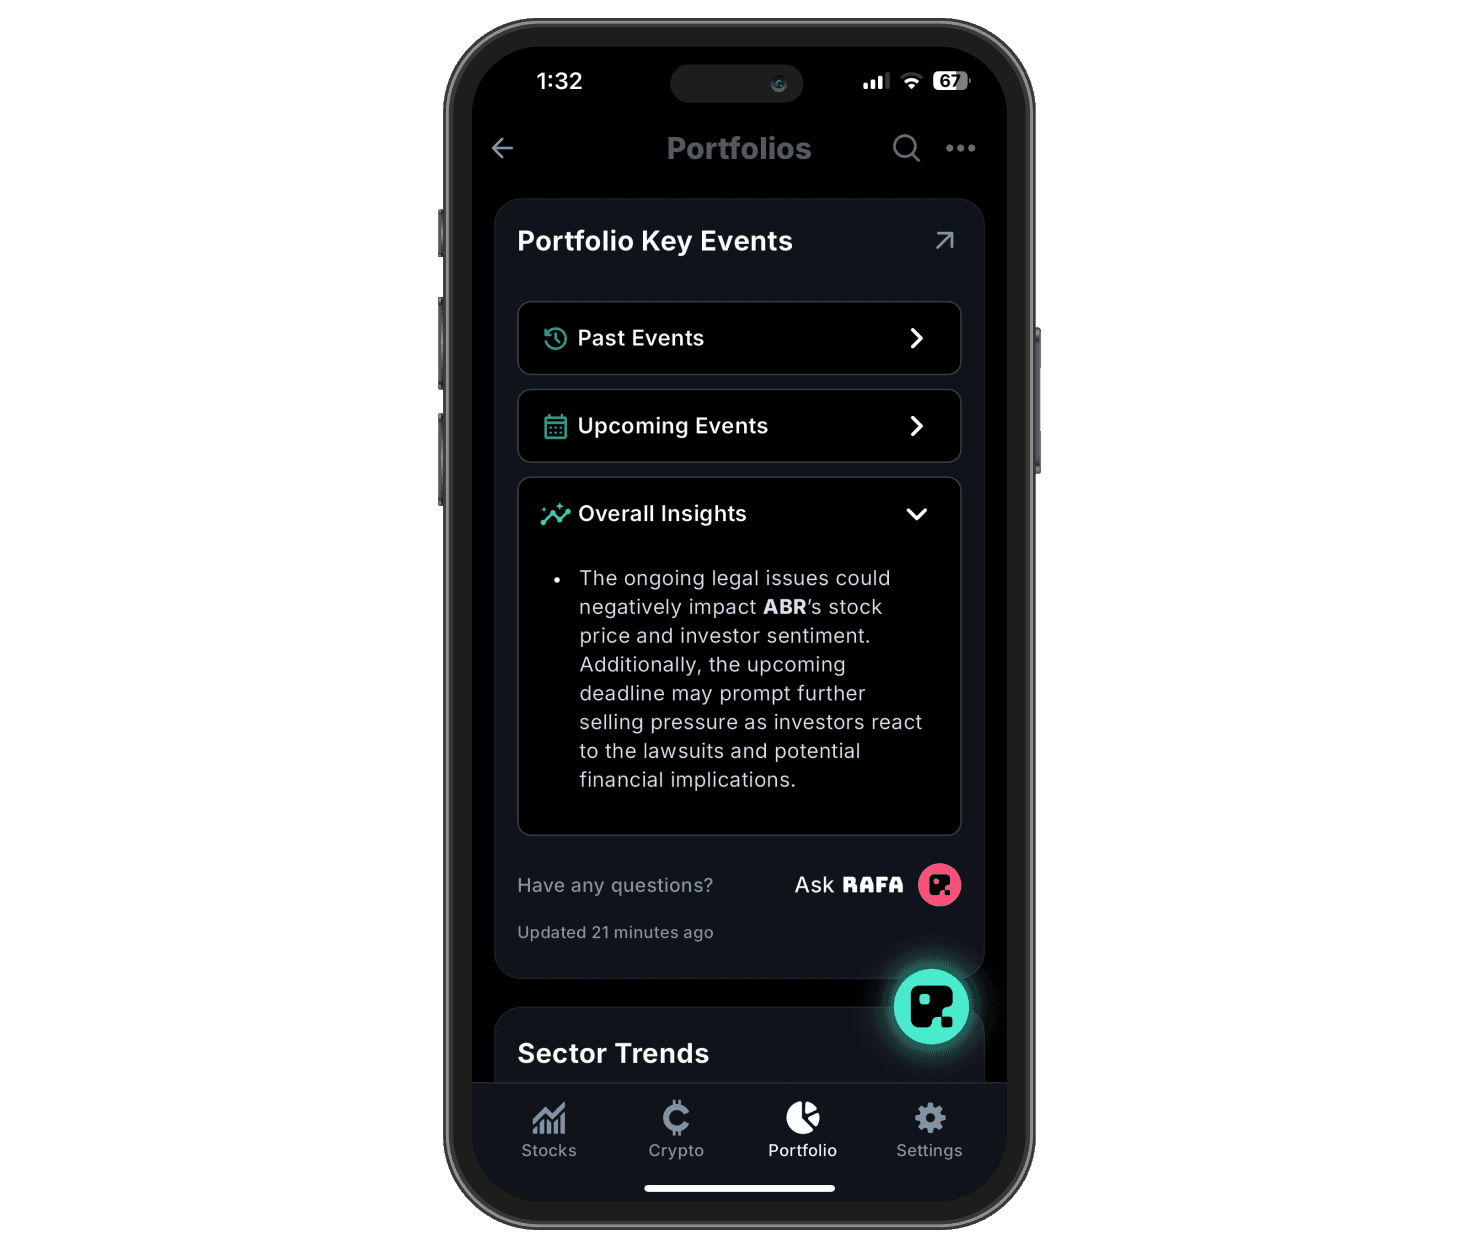
The Portfolio Key Events section highlights important updates regarding your investments.
Past & Upcoming Events: Tap to review past events or track key upcoming dates.
Overall Insights: Displays current market or legal issues affecting specific stocks.
If you need to know more: Click "Ask RAFA" for a detailed news report on your holdings.
This screen helps you stay informed about factors that could influence your portfolio’s performance.
Conclusion
In this guide, you've learned how to navigate your AI-enhanced portfolio dashboard, from basic access to advanced customization. You now understand how to interpret AI-driven insights, leverage multi-agent analytics for risk assessment, and use predictive analytics to optimize your investment strategy. With these skills, you're well-equipped to make data-driven decisions and maximize the potential of your AI-powered portfolio management tools. To get the most out of this feature, learn how to link your accounts and create portfolios.


